符号图组件
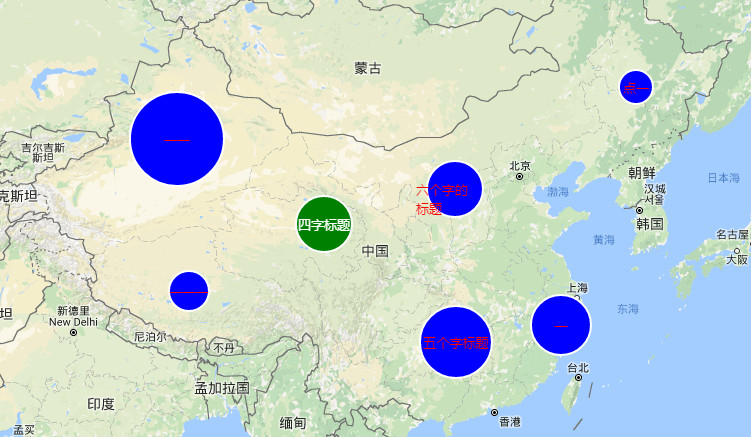
效果图
示例
        //定义样式
        var style = {
            weight : 2,
            opacity : 1,
            fillOpacity : 1,
            color : 'white',
            fillColor : 'blue',
            fontSize: 13,
            fontColor: 'red'
        };

        //鼠标选中时的样式
        var selectStyle = {
            weight: 2,
            color: 'white',
            dashArray: '',
            fillColor : 'green',
            fillOpacity: 1,
            fontSize: 14,
            fontColor: 'white'
        };
        var opt = {
            style : style,
            selectStyle : selectStyle
        }
    //生产符号图的数据结构
    var data = [{
        label : '一',
        latlng : [29.169763146098717, 120.04928890172152],
        radius : 30,
        popupContent : "气泡内容",
        data : {}
    },{
        label : '一一',
        latlng : [42.35854391749705, 86.30859375],
        radius : 47,
        popupContent : "气泡内容",
        data : {}
    },{
        label : '一一一',
        latlng : [31.765537409484374, 87.36328125],
        radius : 20,
        popupContent : "气泡内容",
        data : {}
    },{
        label : '四字标题',
        latlng : [36.56260003738548, 99.228515625],
        radius : 28,
        popupContent : "气泡内容",
        data : {}
    },{
        label : '五个字标题',
        latlng : [27.839076094777816, 110.7861328125],
        radius : 36,
        popupContent : "气泡内容",
        data : {}
    },{
        label : '六个字的标题',
        latlng : [38.993572058209466, 110.74218749999999],
        radius : 28,
        popupContent : "气泡内容",
        data : {}
    },{
        label : '点一',
        latlng : [45.67548217560647, 126.60644531250001 ],
        radius : 17,
        popupContent : "气泡内容",
        data : {}
    }];

    var lyr = W.symbol(data, opt);

    map.addLayer(lyr);
构造方法
| 构造方法 |
描述 |
| W.Symbol(opt) |
构造方法 |
构造属性
| 属性名 |
类型 |
默认值 |
描述 |
| style |
object |
{ weight : 2, opacity : 1, fillOpacity : 1, color : 'white', fillColor : 'red', fontSize: 13, fontColor: 'white' } |
符号图叠加到地图上时的默认样式。 |
| selectStyle |
object |
{ weight: 2, color: 'white', dashArray: '', fillColor : 'green', fillOpacity: 1, fontSize: 14, fontColor: 'red' } |
符号图在鼠标划过时的样式。 |
| callback |
object |
{ click : function(data, marker){ } } |
回调事件集合,当前只支持click回调事件。 |
用法
var symbolLayer = W.symbol(data);
map.addLayer(symbolLayer);